How to Use Sparqly
A step-by-step guide to get insights from your CSV data
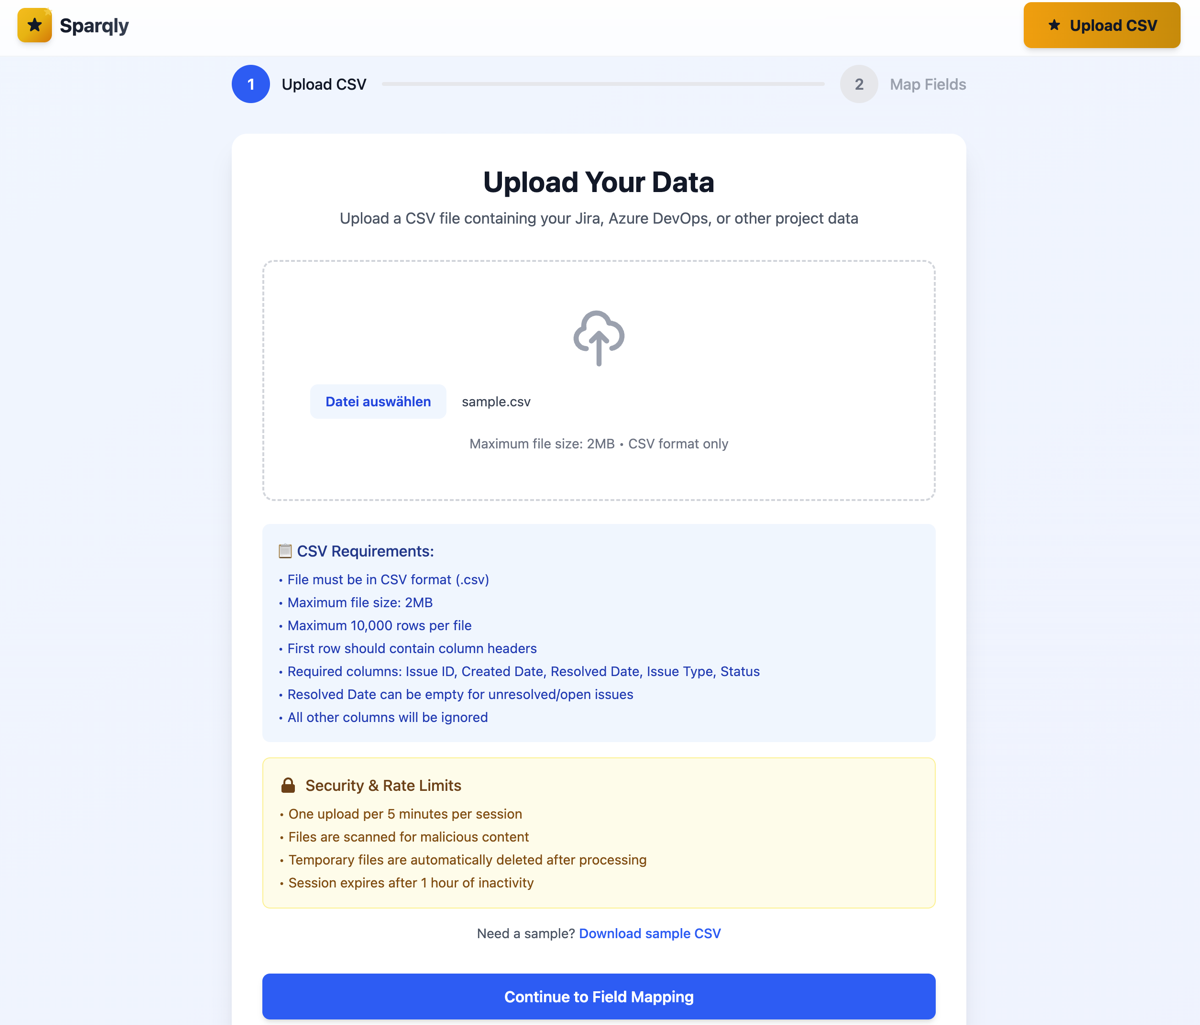
Upload Your CSV
Start by uploading your CSV export from your project management tool. Simply drag and drop or click to select your file.
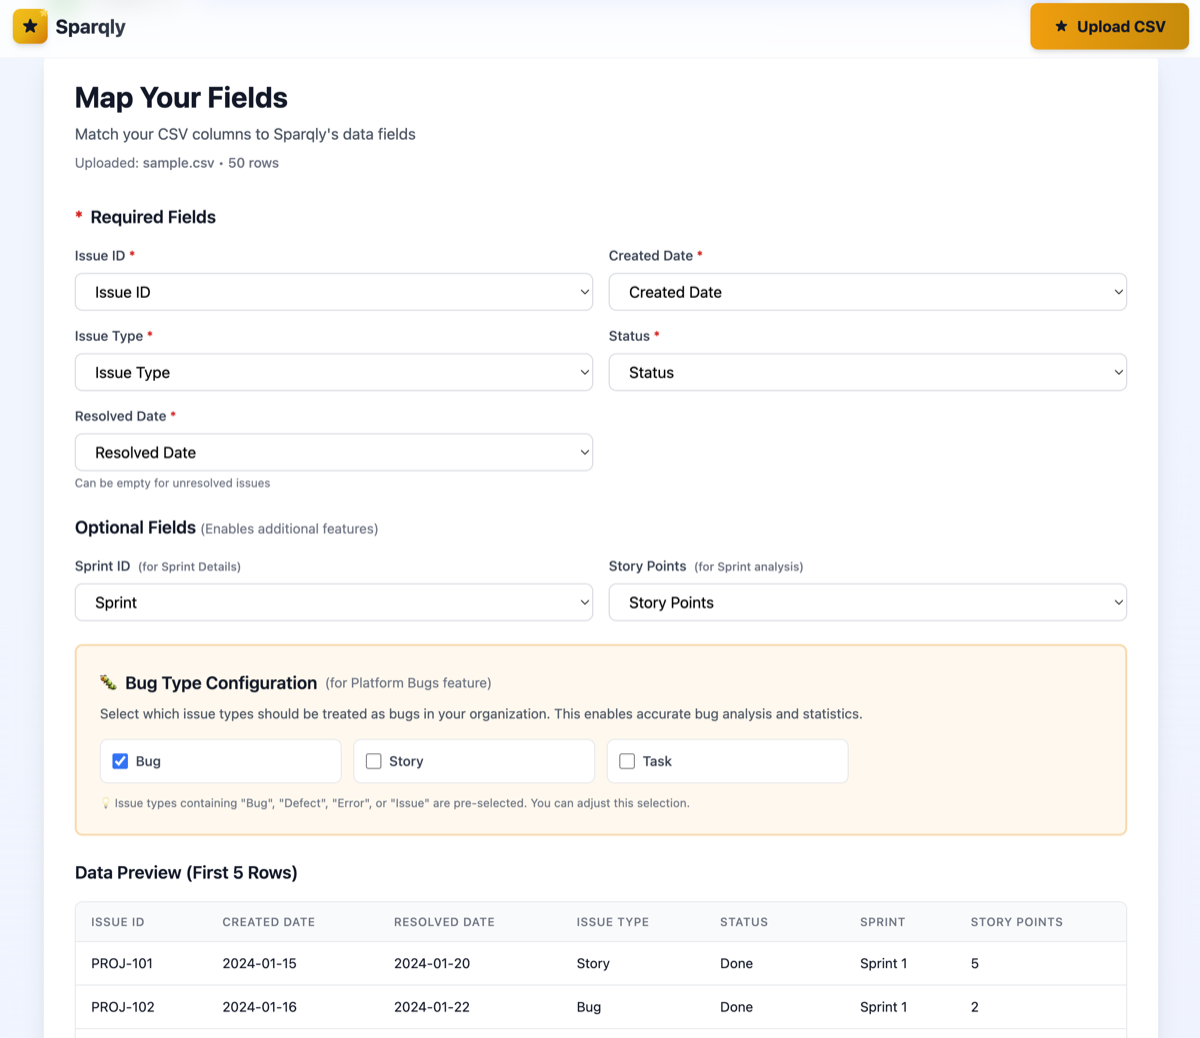
Map Your Fields
Match your CSV columns to Sparqly's fields. We'll try to auto-detect them, but you can adjust as needed.
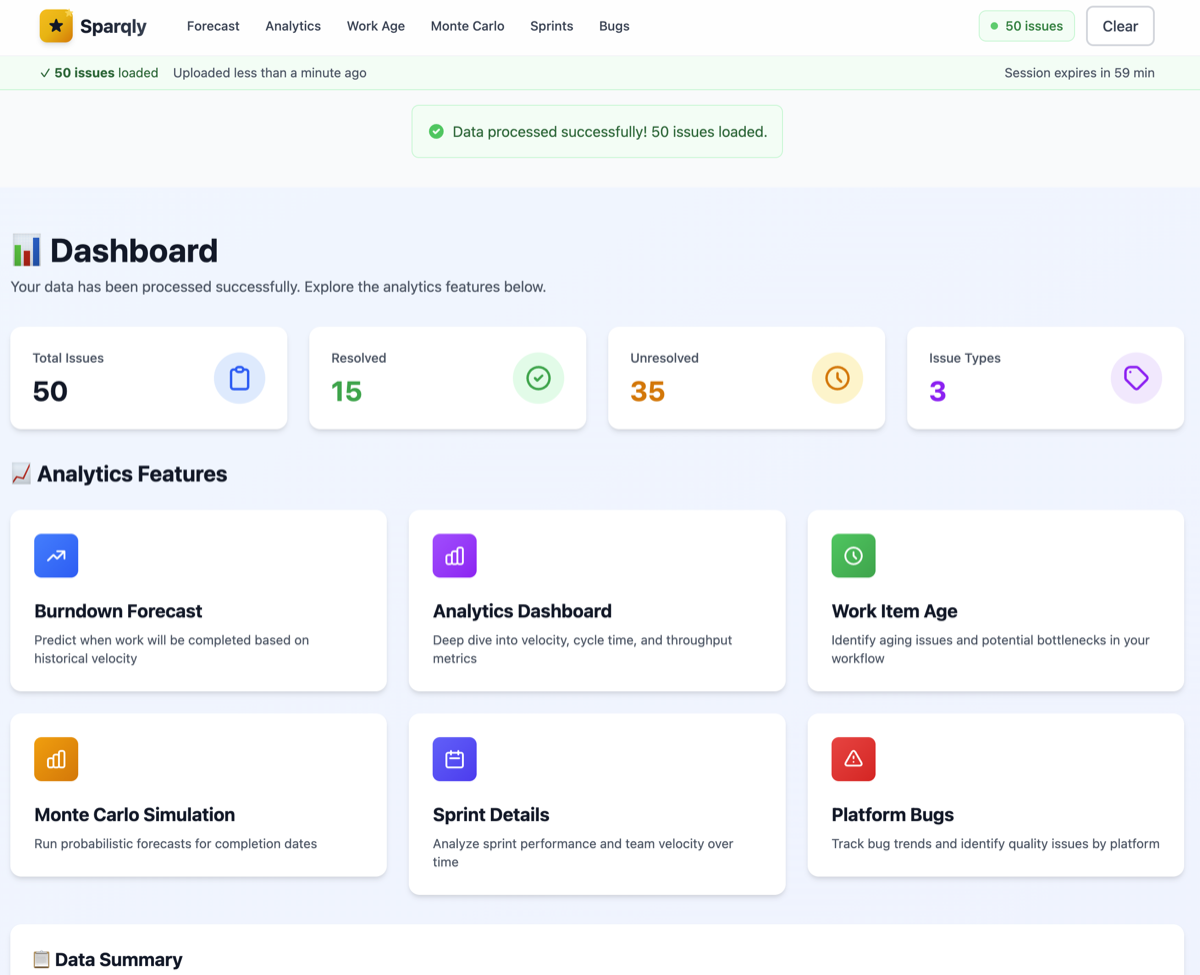
View Your Dashboard
Get an instant overview of your project with key metrics and quick access to all features.
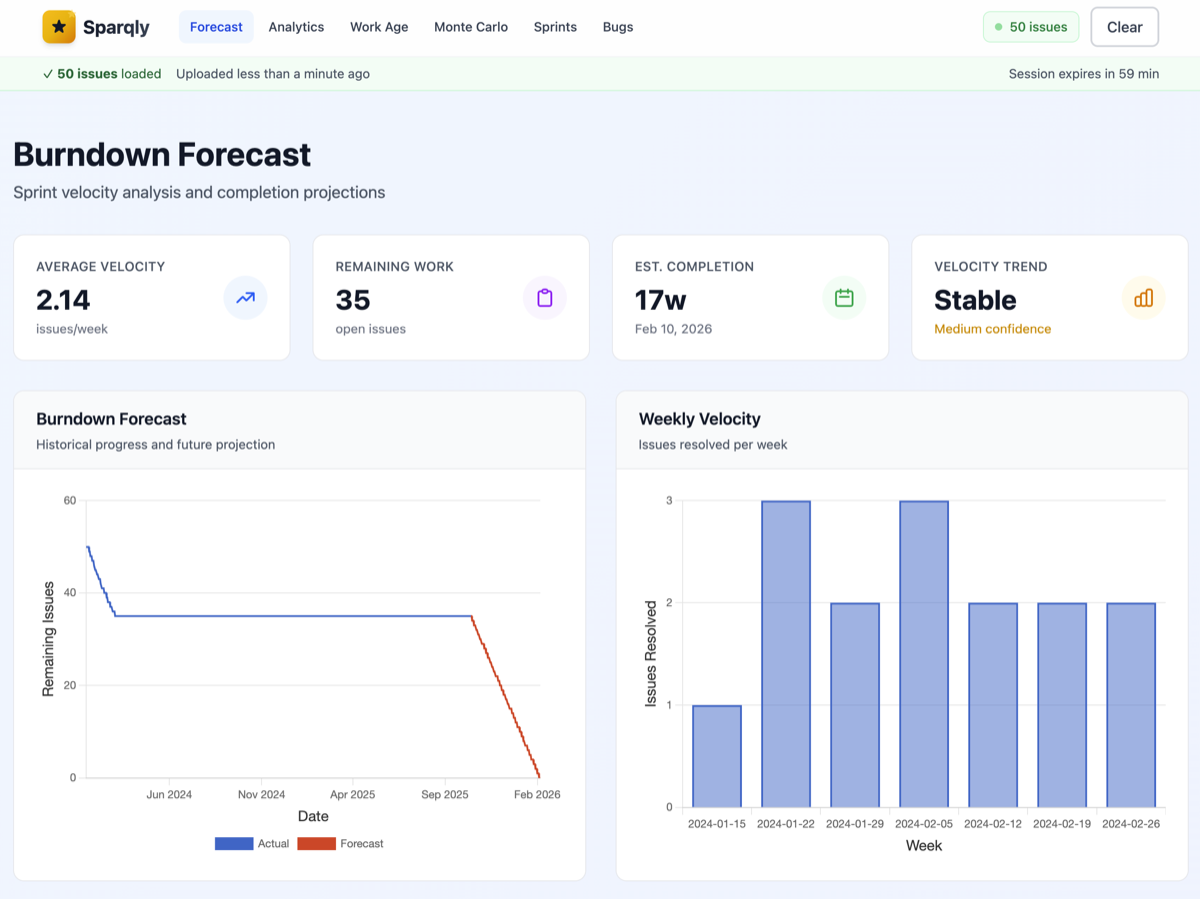
Burndown & Forecast
See your progress over time and get predictions on when your project will complete.
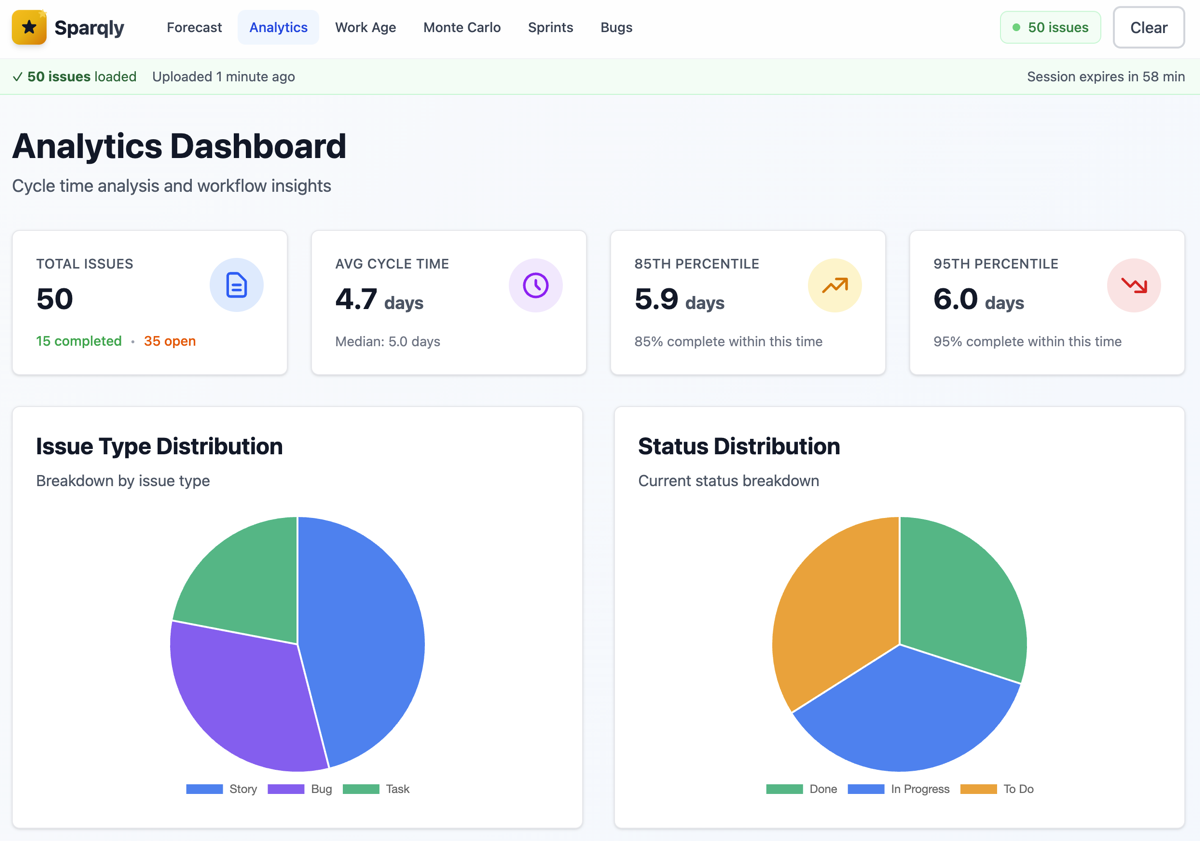
Detailed Analytics
Dive deep into your data with distribution charts, cycle time analysis, and throughput metrics.
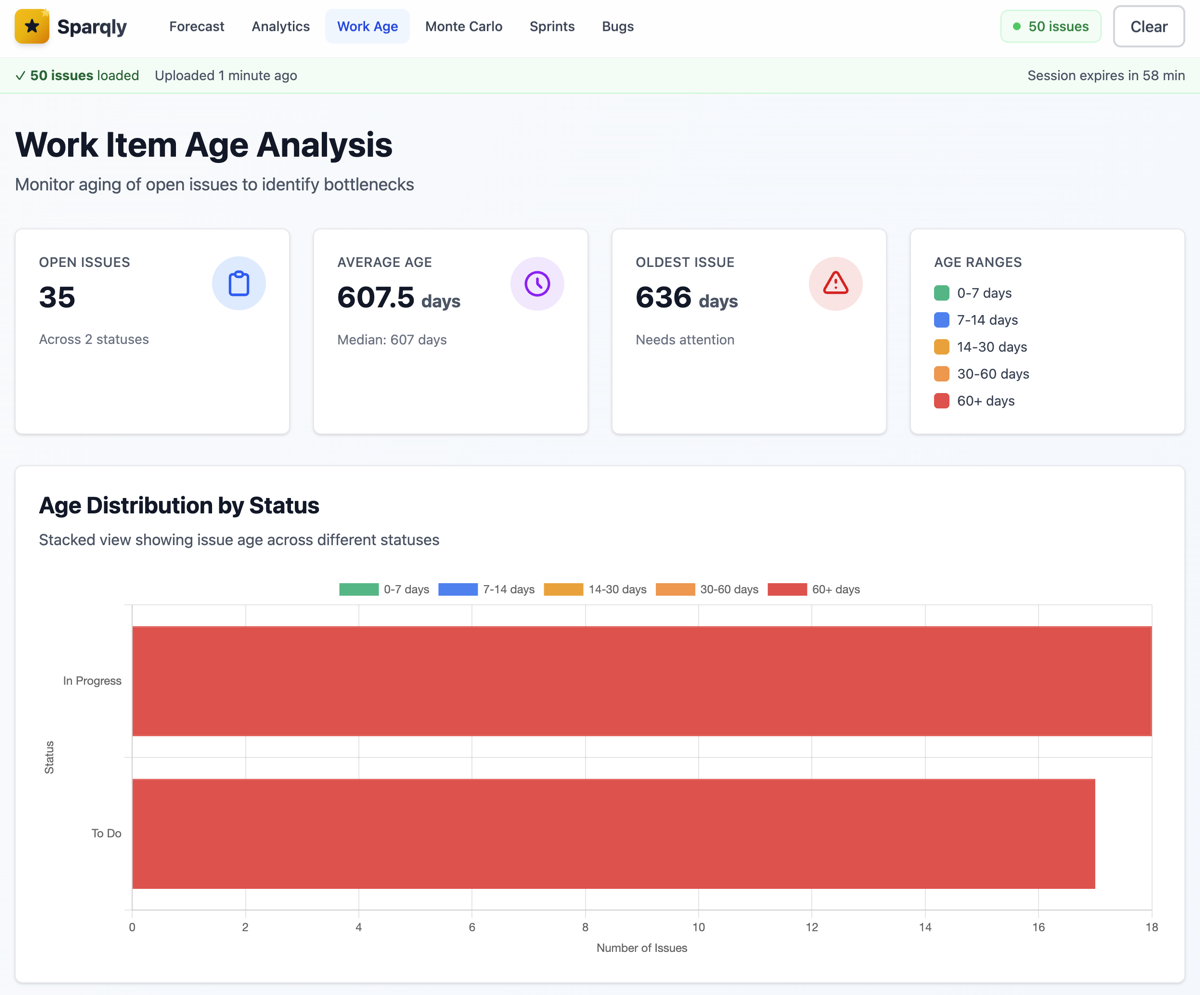
Work Item Age Analysis
Identify bottlenecks by seeing how long work items have been in progress.
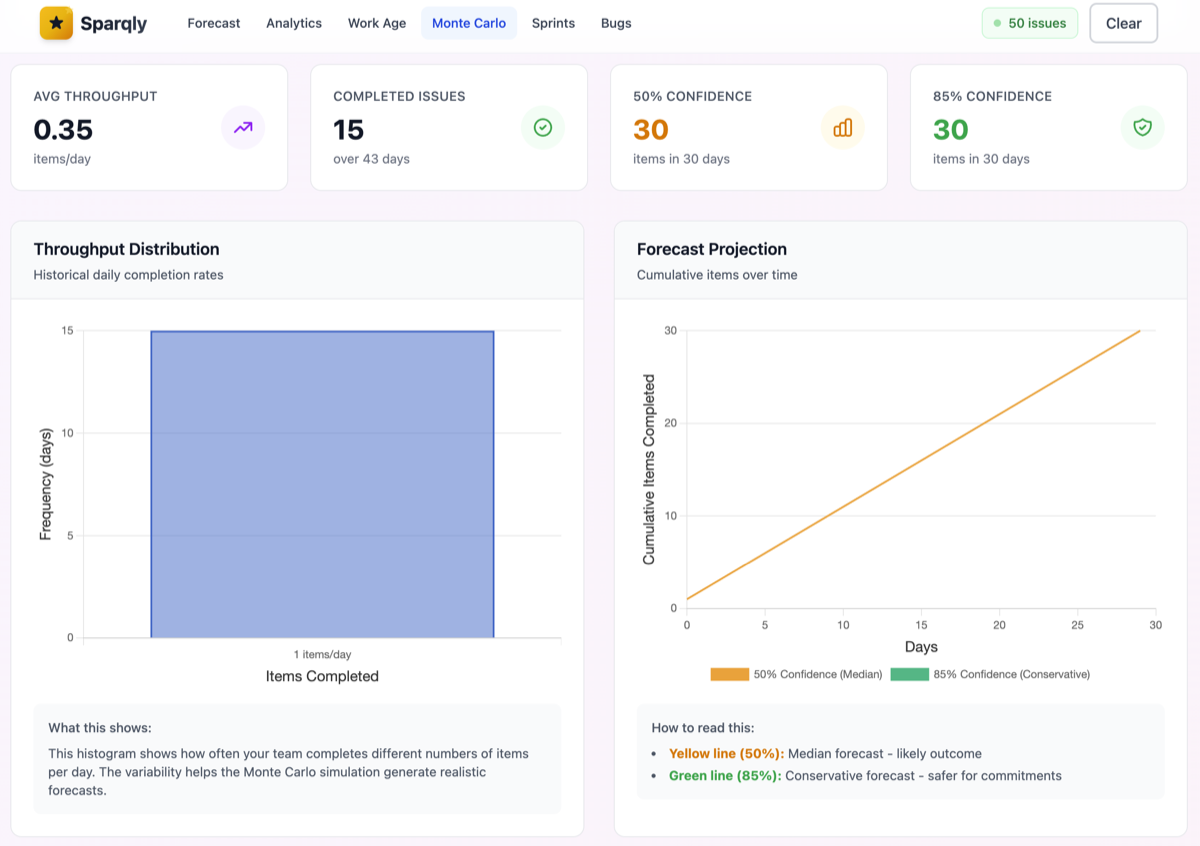
Monte Carlo Simulation
Run probabilistic forecasts to see the likelihood of completing work by specific dates.
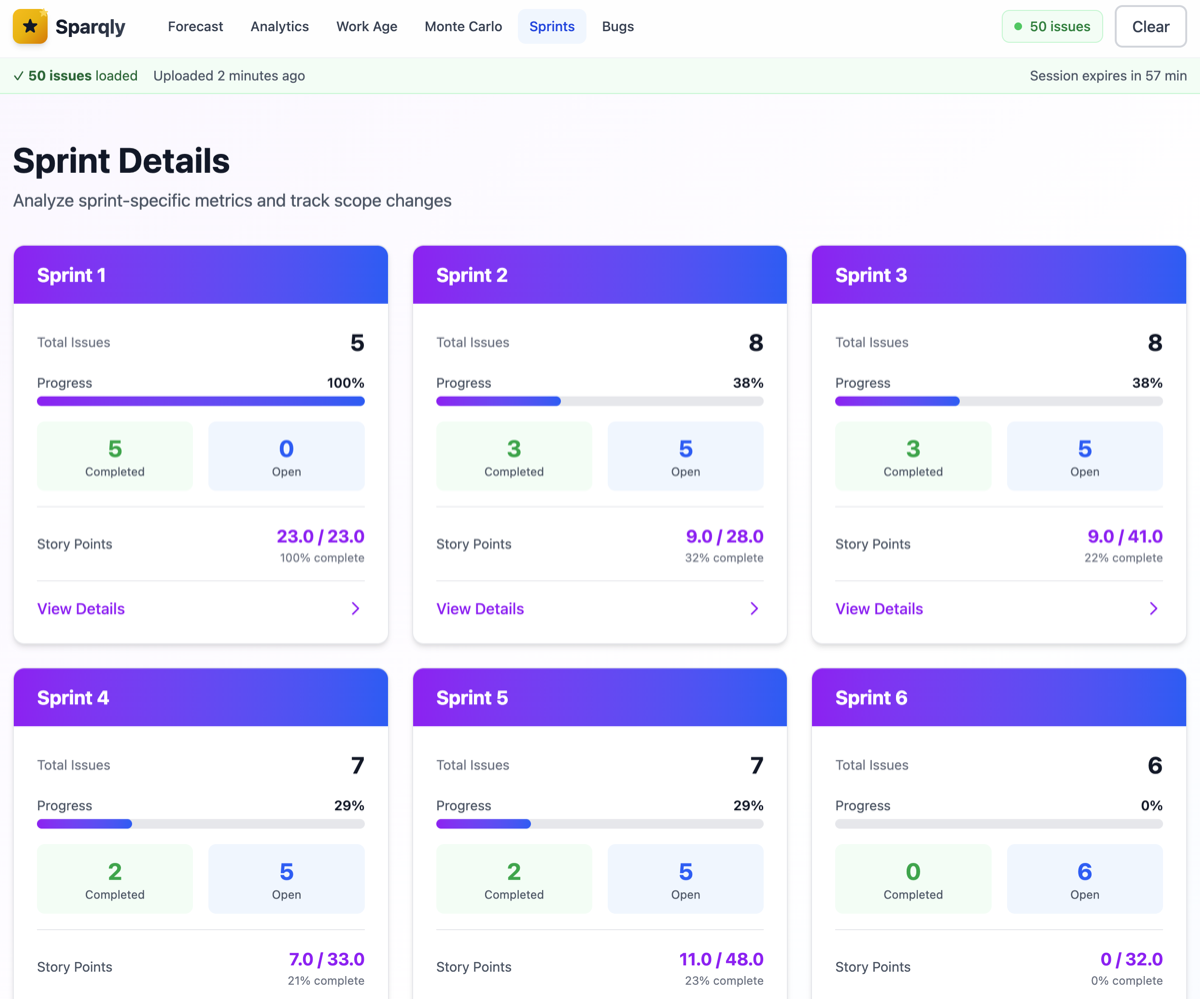
Sprint Analysis
Review individual sprint performance and track velocity trends over time.
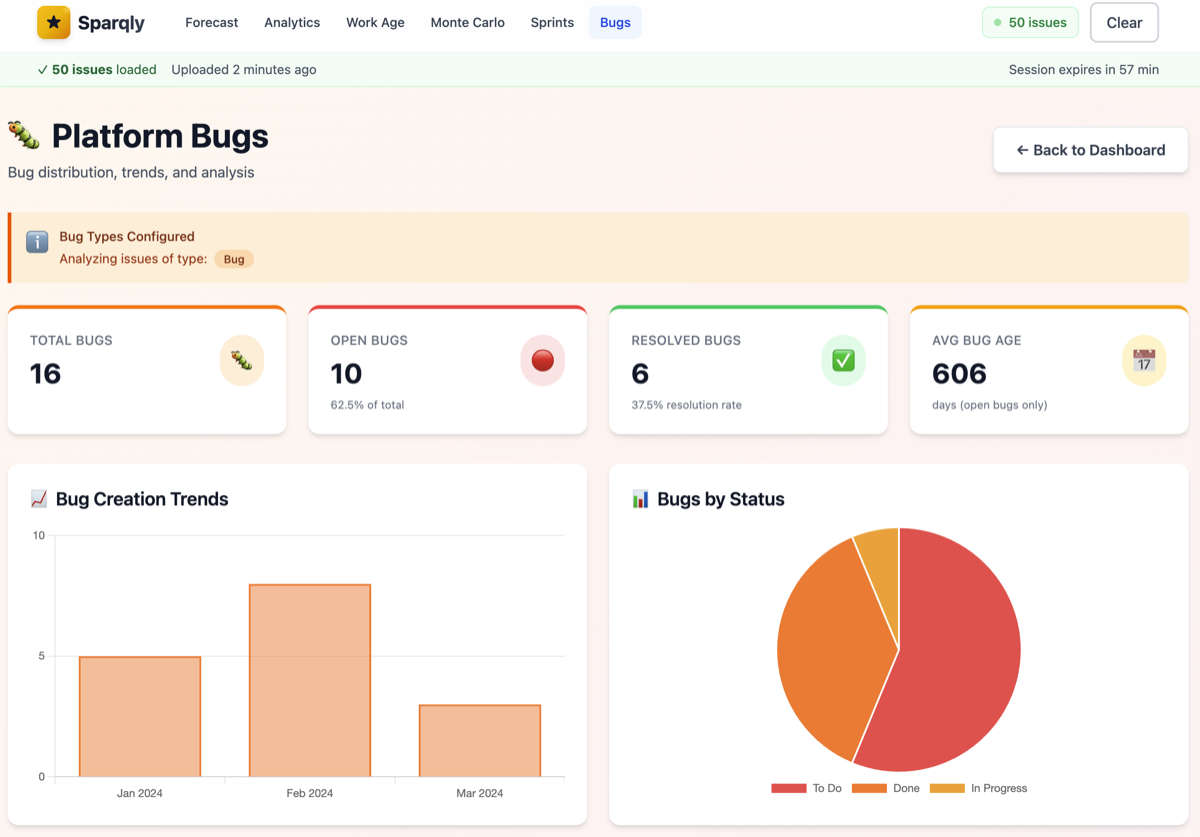
Bug & Platform Analysis
Track bug resolution times and identify patterns across different platforms.
Clean Up
When you're done analyzing your data, click the "Clear" button in the navigation bar to delete all your information from the session.